Most AI Strategies Will Quietly Fail in 2027. Fix This First.
Every CEO wants AI. The leaders who can prove it worked are the ones who keep their budget. The four-step framework that turned guesswork into $1B+ in causally attributed revenue, defensible to any CFO in any room.

TL;DR. Fix Your Foundation Before Your AI Strategy.
Measurement is the only investment in an AI strategy that survives a downturn.
Every CEO is racing to deploy AI. The leaders who can prove it worked are the ones who keep their budget. The reason most can't is simple: they measure platform impact through correlation. The model launched, revenue went up, therefore the model drove the revenue. That logic does not survive a CFO who knows the economy improved, a competitor exited, sales changed strategy, and three other features launched the same quarter.
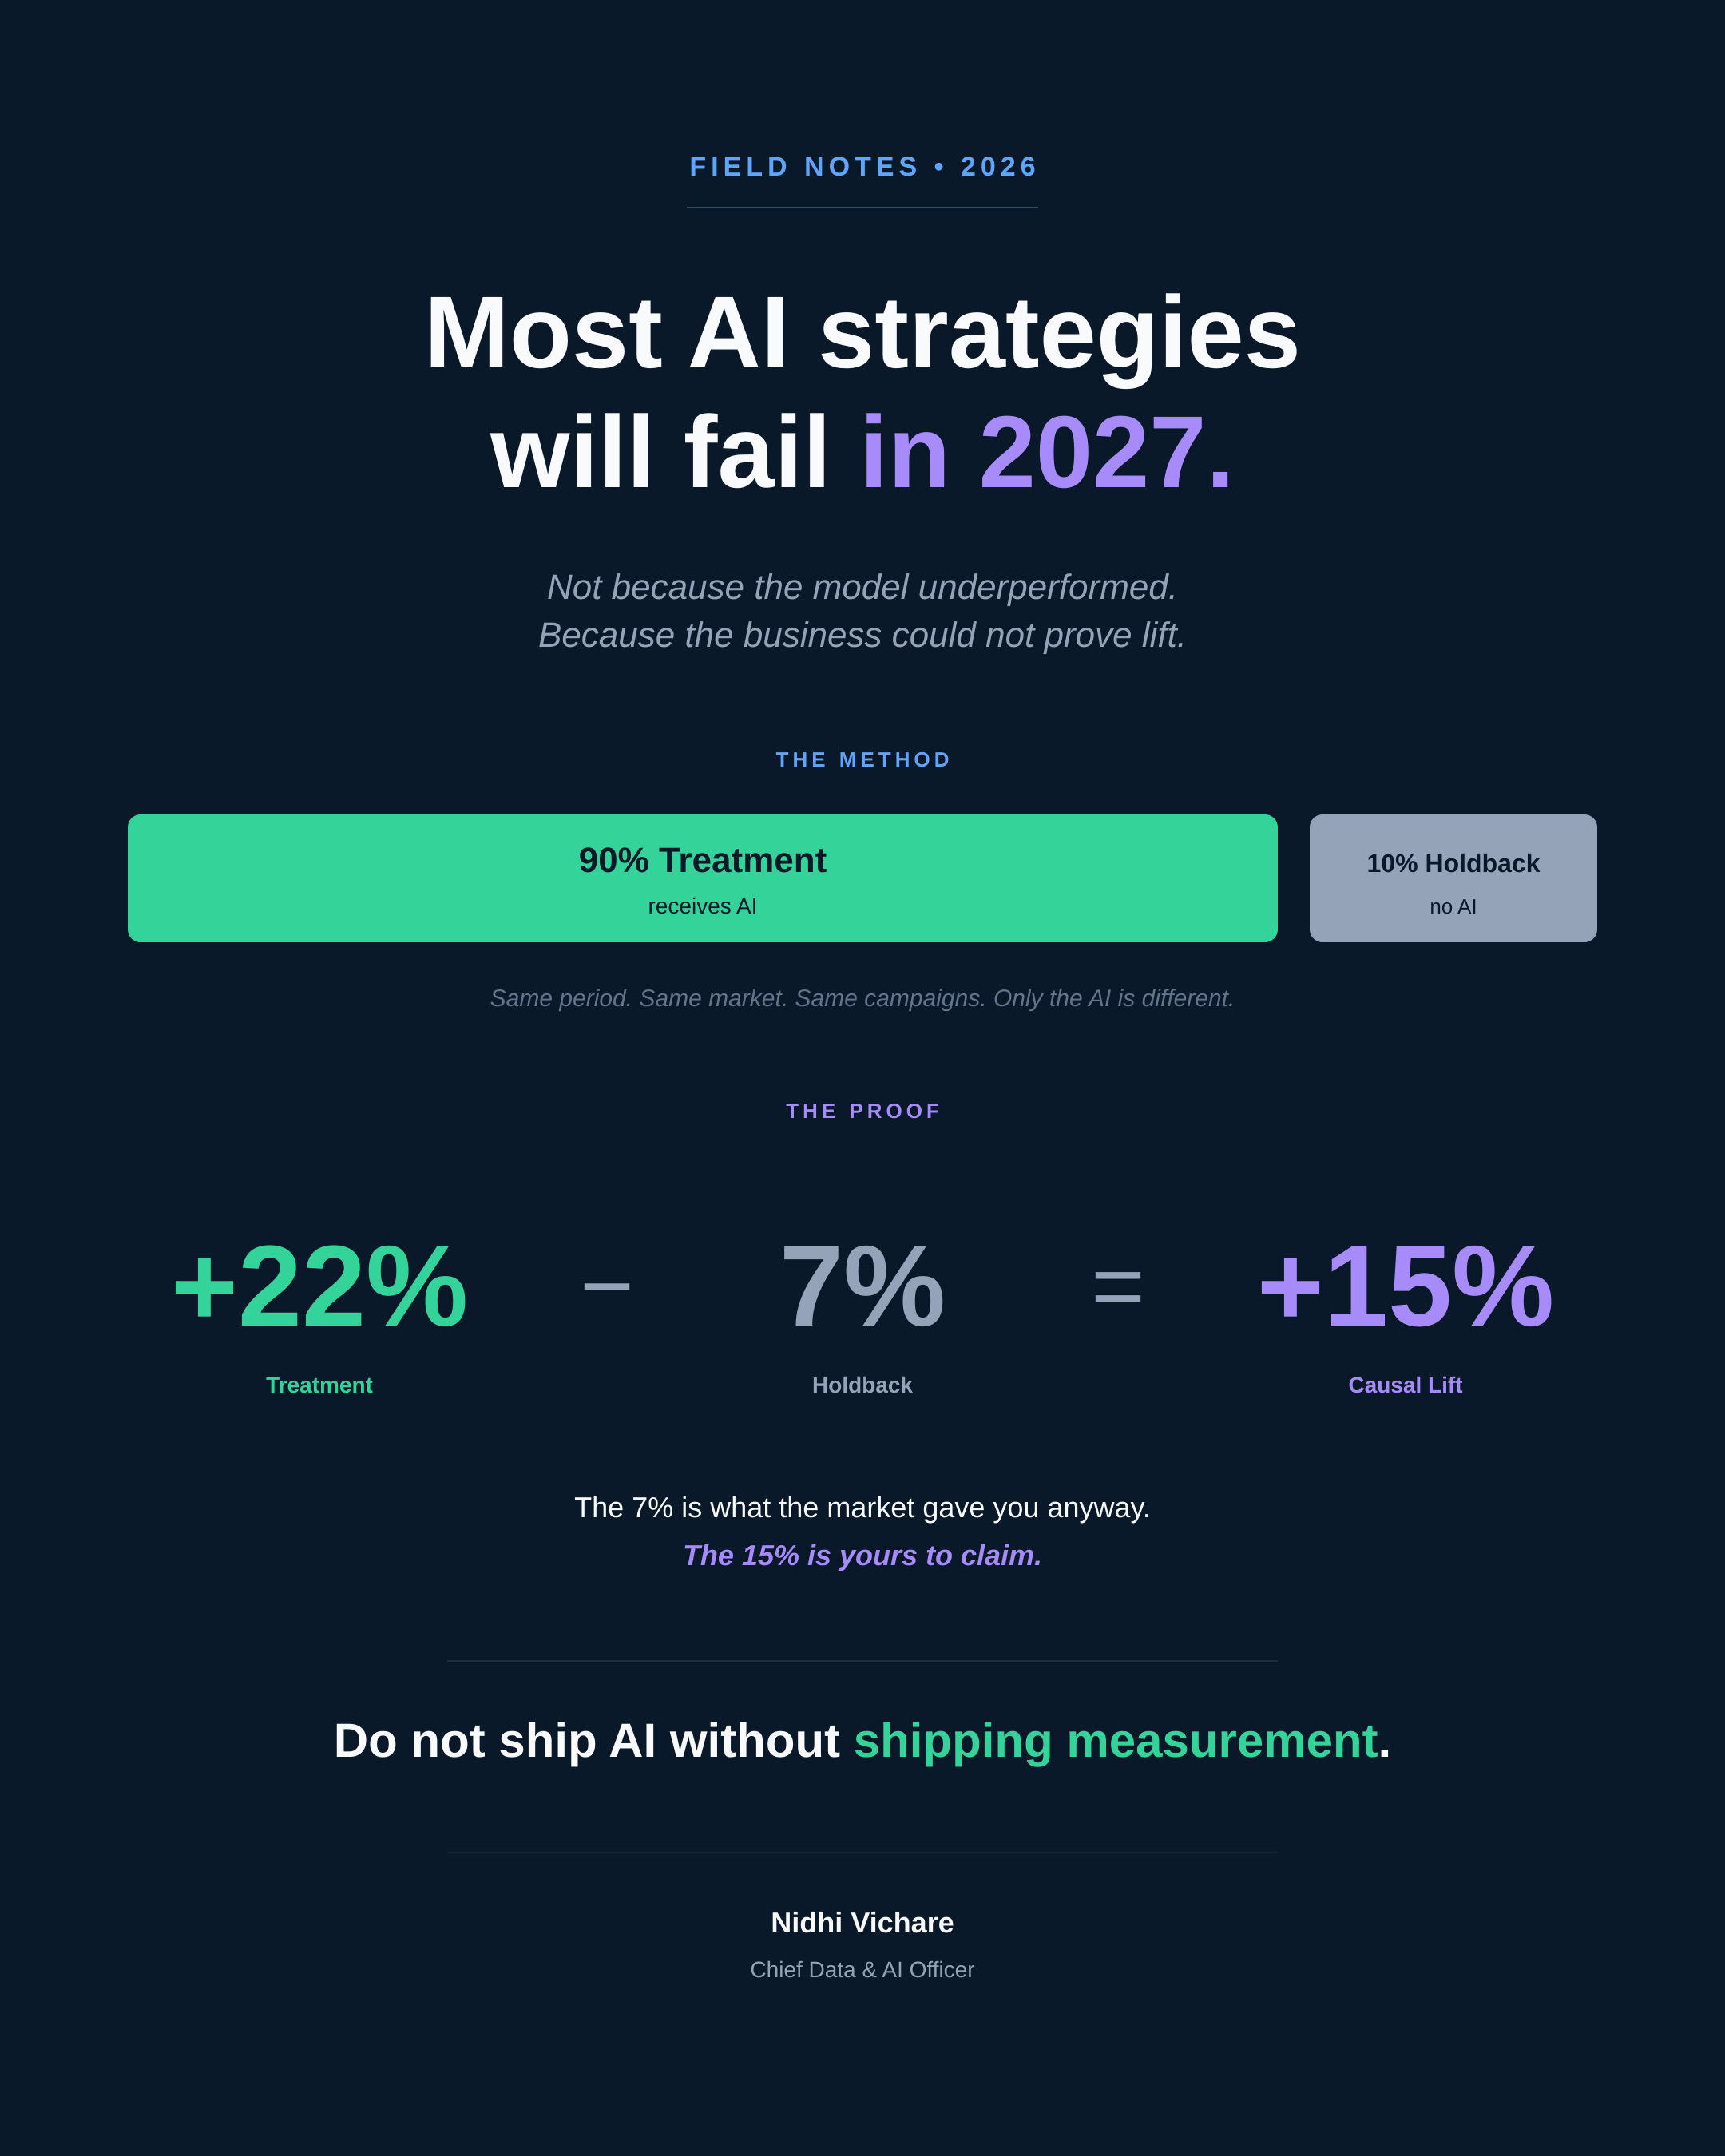
Causation requires a holdback group set up before launch, not after. A subset of users that does not receive the new feature, measured under the same market conditions as the treatment group. The delta between them is the platform's actual lift. Not estimated. Not modeled. Observed.
The teams that build this in from day one walk into the 2027 budget review with per-stream causal numbers and walk out with expanded headcount. The teams that don't will be the ones explaining why their AI initiative deserves another year.
The AI Strategy That Quietly Dies
Your CEO announced an AI strategy this year. Your team built models, deployed agents, integrated LLMs, automated workflows. Revenue went up the next quarter. Everyone agrees the AI is "working."
Then the 2027 budget review arrives. The CFO asks one question:
"Did the AI investment cause the revenue, or would it have happened anyway?"
And the room goes quiet.
This is how AI strategies die. Not from a failed model. Not from a hallucination. From the inability to prove causation when it counts.
If your AI investment can't survive a holdback test, you don't have an AI problem. You have a measurement problem. And measurement problems become leadership problems when the budget gets cut.
The technology worked. The team did good work. But nobody set up the measurement on day one. And "we think the AI is helping" is not an answer the CFO will defend in front of the board.
This is fixable. But it has to be fixed before the launch, not after.
AI Lives or Dies on Data Foundations
Here is the chain that almost no AI strategy makes explicit:

Data is the king. Without clean pipelines, governed lakehouses, contracts, and quality SLAs, you have no signal to measure. Every AI model trained on bad data is a confident hallucination at scale.
Measurement is the bridge. Without prospective baselines and holdback controls, you have no way to prove the AI did anything. The model can be brilliant. The deployment can be flawless. And the CFO will still cut the budget because "we think it's working" is not evidence.
AI success is the outcome, but only if the first two stages exist. Skip stage 1 and your models hallucinate. Skip stage 2 and your AI investment becomes a budget line waiting to be cut.
This is why the smartest CDOs are not racing to deploy more AI. They are racing to fix the foundations underneath the AI, so the AI they already have can finally be proven.
The Problem With Dashboard Metrics
Most data and AI platforms measure their impact through correlation. The platform launched in Q2. Revenue increased in Q3. Therefore the platform drove the revenue.
This logic shows up in every quarterly business review, every board deck, and every budget justification. And it is fundamentally unreliable.

Correlation does not tell you whether the platform caused the outcome. It tells you that two things happened in sequence. A dozen confounding factors could explain the revenue increase, and the platform might have contributed nothing.
When budget season arrives, a platform whose impact is measured by correlation is a platform whose budget is defensible only by faith. And faith is the first thing to go when the CFO is looking for cuts.
I decided early in my career that I would never sit in a budget review without an answer. Not a story. An answer.
The Four-Step Causal Attribution Framework
At Samsung Ads, I built a causal measurement framework into the data platform architecture from day one. Not as an afterthought. Not as a "phase two" analytics layer. As a core architectural requirement with the same priority as data ingestion and governance. The result: $1B+ in causally attributed ad revenue across four streams. Every dollar provable to finance.

Before any platform feature launches, record the current performance metrics across every revenue stream the feature is expected to impact. This baseline must be measured prospectively, using the same methodology, the same data sources, and the same time granularity that you will use to measure the post-launch outcome.
This sounds obvious. Most organizations skip it. They launch a feature, see numbers improve, and retroactively pull historical data to construct a "baseline." But retroactive baselines are cherry-pickable. A prospective baseline removes that temptation.
This is where most organizations stop. They launch the feature to everyone and measure the before-and-after difference. But before-and-after measurement is still correlation, not causation.
A holdback group is a subset of the population that does not receive the new platform feature. They continue operating exactly as before. The treatment group receives the feature. Both groups are measured over the same time period, under the same market conditions.
This requires organizational discipline. Product teams want to launch to everyone. Sales teams want every advantage. It is the only way to prove causation.
With a baseline established and a holdback group running, the comparison is straightforward:
Same time period. Same market conditions. Same everything except the platform feature. If the economy improved, it improved for both groups equally. If a competitor exited, both groups benefited equally. The only difference is the platform feature.
The difference between the treatment group and the holdback group is the platform's causal contribution. This number is provable to finance. It is not estimated by the data team. It is not a model output. It is an observed difference between two groups under controlled conditions.
This framework attributed $1B+ in measurable ad revenue across four streams:
Platform's audience segmentation enabled advertisers to find consumer segments previously invisible. Holdback group used legacy segmentation.
Real-time bidding optimization improved win rates and reduced cost-per-acquisition. Holdback group used previous bidding logic.
Attribution and optimization models enabled campaign adjustments in-flight. Holdback group used static campaign parameters.
Cross-device attribution connected consumer journeys across mobile, CTV, and TV Native. Holdback group used single-device attribution.
Every dollar causally attributed. Not "the numbers went up after we launched." Controlled experiments with documented methodology.
Why Most AI Programs Skip This
If causal attribution is this straightforward, why do most AI initiatives measure their impact through correlation? Why is every AI strategy deck full of "estimated value" and "projected ROI" instead of holdback comparisons?

It requires committing to the experiment before you know the answer
A prospective baseline and a holdback group mean you are designing the measurement before the feature launches. If the feature does not perform, the measurement will show that clearly. Most organizations prefer the ambiguity of correlation because it allows them to tell a positive story regardless of the actual impact.
Causal attribution removes that safety net. You will know the truth. Some teams are not ready for the truth.
It requires organizational authority
Implementing a holdback group means telling a product team that some users will not get the new feature. This is a political act in most organizations.
The data architecture team rarely has the authority to mandate holdback controls. It requires executive sponsorship from someone who cares more about knowing the truth than telling a good story. The sponsorship that made our framework possible came from leadership that understood the difference between "we think the platform works" and "we can prove the platform works."
That distinction is what separates a cost center from a revenue engine.
It requires architectural investment from day one
The measurement framework cannot be bolted on after the platform is built. The data pipelines must be designed to support holdback group segmentation. The baseline instrumentation must be part of the platform's operational layer, not a separate analytics project. The comparison methodology must be documented and repeatable.
This is architecture work, not analytics work. Most platform teams do not think of measurement as an architectural concern. They build the platform, ship the features, deploy the AI models, and then ask the analytics team to figure out whether it worked. By then it is too late. The AI is in production, the budget is committed, and the holdback group that would have proven causation no longer exists.
The Measurement Framework Is the Architecture
This is the insight that changed how I build platforms. The measurement framework is not a reporting layer that sits on top of the platform. It is the platform.

Every feature has a pre-launch measurement window. The platform automatically captures the metrics. This is a pipeline, not a manual process.
Random assignment, logging, auditability. Not an ad hoc process run by a data analyst. A governed, repeatable service.
Statistical approach, confidence intervals, minimum sample sizes, measurement windows. All in operational runbooks. Any auditor can review.
Aggregation hides failures. Per-stream reporting forces honesty about where the platform is working and where it is not.
The Stakes: What Happens to AI in the Next Downturn
Every organization with an AI strategy will eventually face the question: did the AI investment pay for itself?
The organizations that can answer with causal evidence will keep their AI programs, their data teams, and their budgets. The organizations that can only answer with correlation will be the ones explaining why their AI initiative should survive the next round of cuts.
This is what nobody tells you about AI: the most important investment in your AI strategy is not the model. It is the measurement layer that proves the model worked.
AI cannot take off without data foundations. Data foundations are useless without causal measurement. And AI ROI is unprovable without both. Build it in from day one or watch your AI strategy quietly fail in 2027.
What to Do This Week
Define the baseline metrics. Record them prospectively. Make it a launch checklist item with the same weight as QA and security review.
Even a small one. Even 5% of users. Any holdback is better than none. The act of holding back a control group forces the discipline of measurement.
Stop reporting "revenue increased 15% after the platform launched." Start reporting "the treatment group outperformed the holdback group by 15% over the same period, controlling for market conditions."
Walk into the next budget meeting with per-stream causal attribution and watch the conversation change. The CFO cares about provable revenue impact, not pipeline architecture.
If the platform team does not own the measurement framework, it will not be built into the platform. Afterthoughts produce dashboards, not proof.
Frequently Asked Questions
Why do most AI strategies fail the CFO's test?
Most AI platforms measure their impact through correlation. The platform launched, revenue went up, therefore the platform drove the revenue. That logic does not survive a CFO who knows the economy improved, a competitor exited, sales changed strategy, and three other features launched the same quarter. Causation requires a holdback group set up before launch, not after. The delta between treatment and holdback is the platform's actual lift: not estimated, not modeled, observed.
What is the four-step causal attribution framework for AI measurement?
Step one: measure the baseline prospectively using the same methodology you will use post-launch. Step two: launch with a holdback group that does not receive the new feature. Step three: compare outcomes over the same time period under the same market conditions. Step four: attribute the delta as the platform's causal contribution. At Samsung Ads, this framework was built into the data platform architecture from day one and attributed over $1 billion in measurable ad revenue across four revenue streams.
Why do most organizations skip causal attribution?
Three reasons. First, it requires committing to the experiment before you know the answer, which removes the safety net of telling a positive story regardless of actual impact. Second, it requires organizational authority to mandate holdback controls against product teams who want to launch to everyone. Third, it requires architectural investment from day one. The measurement framework cannot be bolted on after the platform is built. Holdback group management must be a platform service, not an ad hoc process.
What does it mean that the measurement framework is the architecture?
Baseline instrumentation is a platform capability with automatic metric capture. Holdback group management is a governed platform service with random assignment, logging, and auditability. Comparison methodology is documented and versioned with statistical approach, confidence intervals, and minimum sample sizes in operational runbooks. Results are reported per stream, not aggregated, because aggregation hides failures. The measurement framework is not a reporting layer on top of the platform. It is the platform.
What should a data leader do this week to start fixing AI measurement?
Before your next feature launch, define the baseline metrics and record them prospectively. Design a holdback group, even at 5 percent of users. Change the language: stop reporting 'revenue increased 15 percent after launch' and start reporting 'the treatment group outperformed the holdback group by 15 percent over the same period, controlling for market conditions.' Walk into the next budget meeting with per-stream causal attribution. Make measurement architectural by assigning ownership to the platform team.
In 2027, half the AI strategies announced this year will be quietly killed. The other half will be expanding their headcount.
The difference will not be the model. It will be whether anyone bothered to set up the measurement on day one.
About the author
Nidhi Vichare is a Chief Data and AI Officer, enterprise AI architect, and data platform executive. She writes about enterprise AI strategy, data architecture, causal measurement, AI ROI, agentic systems, and modern leadership for senior data and AI leaders.